Omnipod® 5 and compatible sensor integrations

How to get the full experience for your patients
In order to get all of the advantages of automated insulin delivery (AID), your patients need a sensor. With a sensor connected, Omnipod 5 automates insulin delivery to help keep your patients in range, day and night.1-2
Works with the leading sensor brands
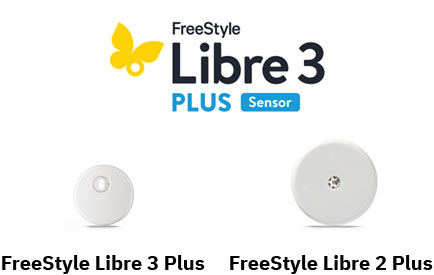
The Omnipod 5 Automated Insulin Delivery System is integrated with the following sensors:

Benefits of using an integrated sensor

The Omnipod 5 Algorithm
To help protect against highs and lows1-2 our algorithm adjusts to your patients’ insulin needs every 5 minutes based on readings from your sensor.

SmartBolus Calculator
The SmartBolus Calculator can suggest a bolus dose based on carb amounts and current sensor trend and value.

Activity Feature
When enabled, this feature reduces insulin delivery for times when glucose typically goes low, like during exercise.
Supporting optimal sensor performance: Line of sight
For Omnipod® 5 to receive glucose readings every five minutes, the Pod and sensor must have a clear “line of sight.” This means both devices should be worn on the same side of the body, without tissue blocking the Bluetooth® signal.
To help your patients learn how to optimise Pod and sensor placement for reliable sensor connectivity, share the following supporting materials:
Looking for more information?
1. Brown S. et al. Diabetes Care. 2021;44:1630-1640. Prospective pivotal trial in 240 participants with T1D aged 6 - 70 yrs. Study included a 14-day standard therapy (ST) phase followed by a 3-month Omnipod 5 hybrid closed-loop (HCL) phase. Average time in range (70-180mg/dL or 3.9-10 mmol/L) (6AM-12AM) in adults/adolescents and children for standard therapy vs Omnipod 5 = 64.8% vs. 72.5%; 51.5% vs. 64.6%. Average time in range (70-180mg/dL or 3.9-10 mmol/L) in adults/adolescents and children for standard therapy vs Omnipod 5 = 64.3% vs. 78.1%; 55.3% vs. 78.1%. Mean time in hyperglycaemic range (>10.0 mmol/L or >180mg/dL) as measured by CGM in adults/adolescents and children ST vs. 3-mo Omnipod 5: 28.9% vs. 22.8%; 44.8% vs 29.7%, P<0.0001, respectively. Mean time in hypoglycaemic range (<3.9 mmol/L or <70 mg/dL) as measured by CGM in adults/adolescents and children ST vs. 3-mo Omnipod 5: 2.89% vs. 1.32%, P<0.0001; 2.21% vs. 1.78, P=0.8153, respectively.
2. Sherr J. et al. Diabetes Care. 2022; 45:1907-1910. Single-arm multicenter clinical trial in 80 pre-school children (aged 2-5.9 yrs) with T1D. Study included a 14-daystandard therapy (ST) phase followed by a 3-month AID phase with Omnipod 5system. Average time in range (70-180mg/dL or 3.9-10 mmol/L) (6AM-12AM) in standard therapy vs Omnipod 5 = 56.9% vs. 63.7%. Average time in range (70-180mg/dL or 3.9-10 mmol/L) (12AM-6AM) from CGM in standard therapy vs. Omnipod 5 = 58.2% vs 81.0%. Mean time in hyperglycaemic range (>10.0 mmol/L or >180mg/dL) as measured by CGM in children ST vs. 3-mo Omnipod 5: 39.4% vs. 29.5%, P<0.0001, respectively. Mean time in hypoglycaemic range (<3.9 mmol/L or <70 mg/dL) as measured by CGM in children ST vs. 3-mo Omnipod 5: 3.43% vs. 2.46%, P=0.0204.